Welcome to The Bad Debt Read
This is the first issue of a weekly Monday-morning read on multifamily bad-debt patterns — built from public court records and county assessor data across major Sunbelt metros, starting with Houston.
If you underwrite, broker, or lend on multifamily, this is the line item the offering memorandum doesn't surface. Aggregate, investor-side, source-cited. Five minutes every Monday.
The 5.6× gap
One Houston multifamily operator runs about 1.3% bad debt across its portfolio — a figure that wouldn't trigger second-look diligence on an OM.
The same operator runs an estimated 6.5–8.3% bad debt at a single 271-unit Class A high-rise in Downtown Houston (77002).
That's a 5.6× gap between the portfolio average and the specific building you'd actually be bidding on. The trend at that asset isn't flat either: filings rose from 1 in December to 13 in April. By the time the OM hit the market, the building had already been warming up for months.
→ See the full asset breakdown on baddebt.io
Why this matters for underwriting: 100 bps of bad debt is roughly 20 bps of cap rate you're mispricing on the bid. The portfolio average tells you the operator is competent. It doesn't tell you the specific building is the one carrying the loss.
Houston scorecard
The current read across Harris County (Nov 2025 – May 2026):
- 39,874 eviction filings tracked
- $37.2M court-confirmed bad debt (sum of plaintiff-win judgment dollars)
- 0.9% – 7.9% bad-debt range across verified operators (% of GPR)
- 1,114 filings last complete week (week of May 25), down from 1,992 the week prior — Memorial Day closed the courts Monday
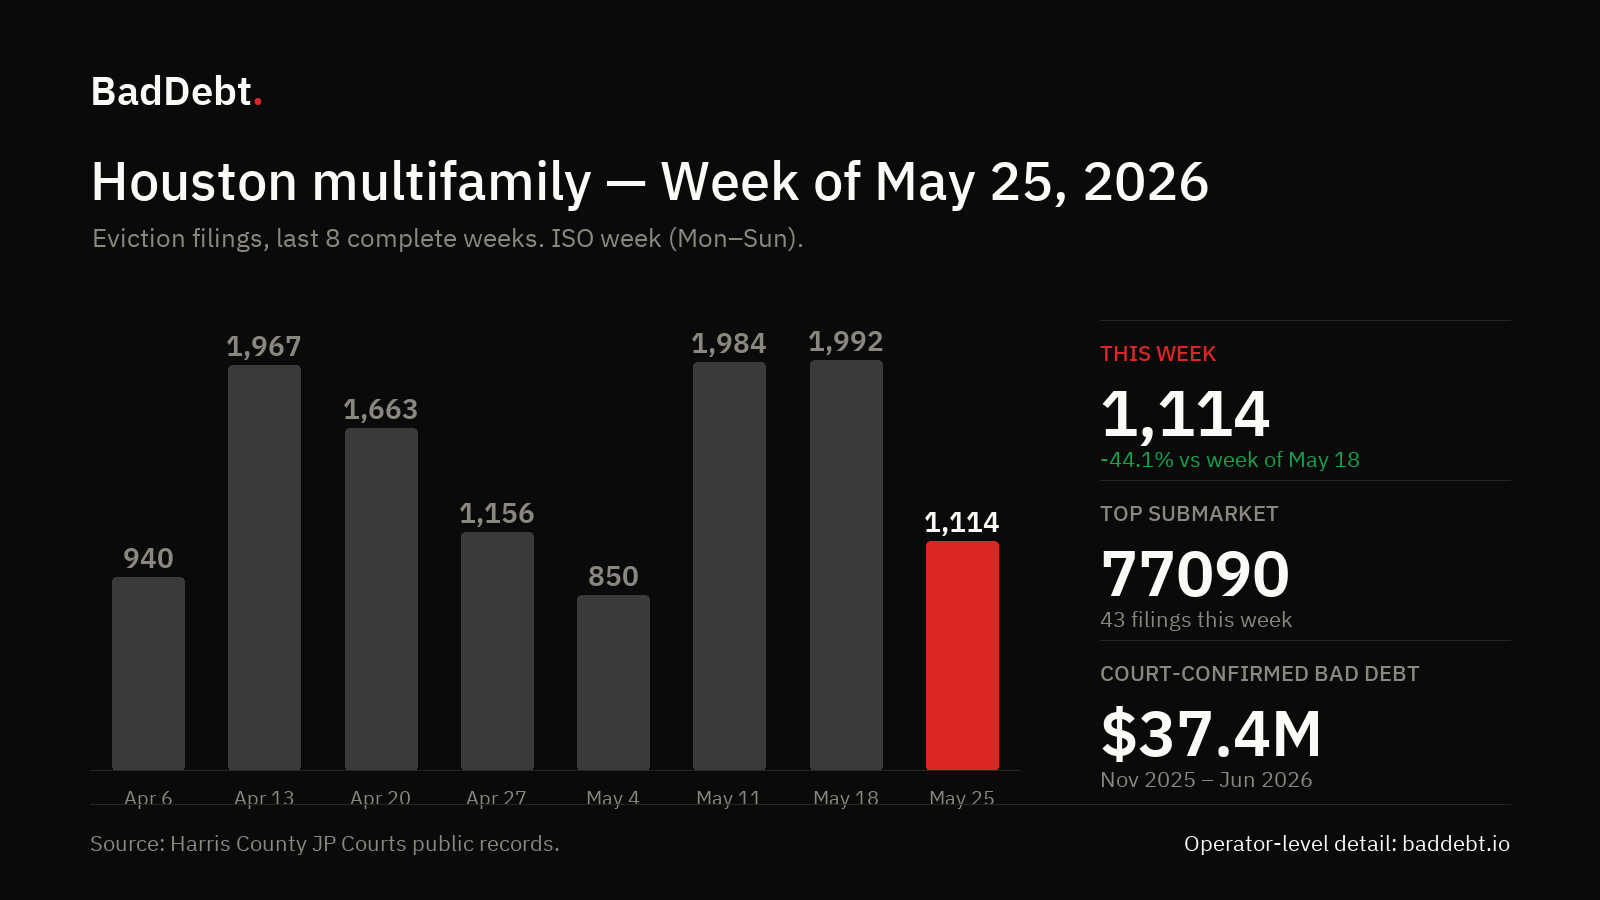
That weekly chart is what you'll get every Monday. Pattern to watch: filings dip the first week of each month (the rent-cycle grace period) and surge weeks 2–3. Holidays compress the count too — Memorial Day took roughly 400 filings off W22.
How we get the number
Bad debt % = estimated rent loss ÷ Gross Potential Rent (units × rent × window).
Rent loss is estimated per eviction case from its court disposition. Displacements carry court-recorded past-due rent plus a turnover allowance. Cured cases (tenant paid and stayed) carry a partial loss. Unit counts come from HCAD assessor parcels where matched; affordable (LIHTC/subsidized) properties are excluded from market-rate figures.
Source: Harris County Justice of the Peace Courts public records + Harris County Appraisal District. Full methodology and confidence bands: baddebt.io.
What you'll get from this newsletter
Every Monday morning, five minutes. Always:
- The Houston weekly read — filings, bad-debt rate, what changed
- One drill-down — a submarket, an asset class, or an operator-level pattern
- Methodology when it matters — so you can defend the number to your IC
Operators are de-identified on the public side — names unlock for subscribers in the dashboard launching this summer.
Next Monday: a Class A vs Class B vs Class C breakdown for Houston — where the spread actually concentrates.
Reply to this email if there's a submarket, asset class, or methodology question you'd like covered. I read every one.
— Jared
Founder, BadDebt
baddebt.io · @baddebtio
P.S. If a colleague underwrites multifamily, forward this. New subscribers help me prioritize what to cover next.